Download a copy of the report here: Cost of Accessing Education Report 2024
Introduction
The United Kingdom has been facing a cost-of-living crisis since late 2021 in which wages and benefits have not increased by as much as the cost of essentials, such as food, energy and housing. Families have been left struggling to cope financially, leaving many unable to cover their minimum needs, including their children’s education. At Citizens Advice County Durham, a great increase in the number of people, seeking financial advice, have reported problems with school associated costs, even though in theory primary and secondary education is free. This increase in people struggling to cover their children’s education is in line with North East England’s dramatic increase in child poverty in the past six years and now has the country’s highest child poverty rate.
Against this backdrop and inspired by Children North East and Child Poverty Action Group’s Report on The Cost of the School Day in England Citizens Advice County Durham carried out a questionnaire-based survey between July and October 2023 to enquire about the hidden costs of primary and secondary education. The run of the questionnaire coincided with the start of the first term of the 2023-24 academic year. The questionnaire contained questions on general demographical information along with others on the costs of school uniform, school meals, along with further questions on the financial burdens incurred with curricular and extra-curricular based materials and activities. Questions were also posed concerning the effects of the costs of schooling on the overall family financial situation.
Completed online questionnaires were received from 535 parents/carers whose children attended schools based in County Durham. Of these, 265 (49.7%) had children attending primary school and 268 (50.2%) attended secondary school. In total, children attended 77 different schools, 50 primary and 27 secondary schools.
Most respondents to the questionnaire reported that due to the rise of the cost of living, they would not be able to afford the costs of their children accessing education without cutting back on essentials e.g. food, heating, bills.
Three major causes were identified as:
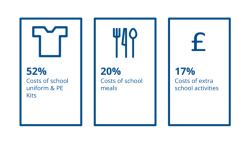
This report presents findings, and survey respondents’ recommendations for easing the costs of accessing primary and secondary education in the County of Durham that could inform and be implemented before the start of the 2024 academic year.
Demographics
The survey’s sample of respondents largely matches the County of Durham’s demographic data, and therefore represents its population accurately. However, 93% of the people who filled out the survey identified as female, meaning that they are overrepresented in the findings.
The age range of respondents showed that 83% to be aged less than 45 years of age. Those aged 31 to 45 years constitute 73% of the sample, 8% were over 50 and 1% below 25 years of age.
Nearly half, 49%, of respondents stated that they did not identify/participate with any religion, whilst 46% identified as Christian and 0.6% Muslim this reflects the same percentage as the 2021 census. Other religions made up a total of 1% and 4% preferred not to say.
Most of the sample, 98%, identified themselves as White. People identifying as Asian or Asian British constituted 0.6% of the sample along with other categories; Black, African, Caribbean; Black British; Gypsy or Irish Traveller; and Mixed or multiple ethnic groups each constituting 0.4 %.
Of the total sample 13% stated that they identified as disabled and 2% preferred not to say.
Children were looked after by either one or two parents/carers, according to 95% of respondents. A quarter reported that they were the single parent/carer and 4% stated that three or four individuals acted in this role.
Half of the sample reported that they had one child attending school, 39% stated two children, 8% said three children and four children were reported by 2%.
When asked if they had children with SEN or disability, 29% stated ‘yes’, and 2% preferred not to say. Of those stating ‘yes’, 40% said their children suffered from Autism/ASD. ADHD was specified by 10%. Other disabilities included Cerebral Palsy, Speech problems, Dyspraxia, Dyslexia, Deafness, and Anxiety were each cited by 4% of respondents. In addition, 12% stated that their children had SEND without further specification.
Income
Gross Annual Household Income ranges of individuals in the sample is shown in the table below. The average annual household income is in the range £23,881 to £32,200. Of the sample 53% identified that this was below £32,200 and 65% have incomes less than £43,340.
| Annual Income | No | % |
| No income | 8 | 1.5% |
| £1 – £15,380 | 100 | 18.7% |
| £15,381 – £23,880 | 94 | 17.5% |
| £23,881 – £32,200 | 68 | 12.7% |
| £32,201 – £43,340 | 66 | 12.3% |
| £43,341 – £65,590 | 80 | 14.9% |
| £65,591 – £86,680 | 42 | 7.8% |
| £86,681 – £131,180 | 20 | 3.7% |
| More than £131,180 | 4 | 0.7% |
| Prefer not to say | 53 | 9.9% |
*Gross annual income per household.
A total of 53% stated that their households currently receive Government benefits and 4% preferred not to say.
School Uniforms
A total of 531 subjects (99.4%) reported that they paid for school uniforms and PE kit.
The reported cost of School Uniform and PE kit for one child per school year is shown in the table below. The average spend on school uniforms is between £151 and £200 per year with a cost of over £200 annually reported by 31% of respondents.
- Families with primary school children: average annual spend between £101 and £150
- Families with secondary school children was £151 to £200. For secondary schools 91% reported paying over £100 per year and 25.6% spent over £200 annually.
| Annual Cost of Uniform | Primary | Secondary | Total | |||
| No | % | No | % | No | % | |
| £1 – £50 | 17 | 6.4% | 3 | 1.1% | 20 | 3.9% |
| £51 – £100 | 65 | 24.4% | 22 | 8.2% | 87 | 16.2% |
| £101 – £150 | 63 | 23.7% | 61 | 22.7% | 124 | 23.1% |
| £151 – £200 | 62 | 23.3% | 74 | 27.5% | 136 | 25.4% |
| £201 – £250 | 30 | 11.3% | 59 | 21.9% | 89 | 16.6% |
| Over £250 | 29 | 10.9% | 50 | 3.7% | 79 | 14.7% |
*Annual cost of uniform per one child.
A school logo was required on at least one item of school uniform or PE kit according to 64% of respondents. 91% of primary school children did not require school logos while 75% of secondary school children reported a logo was required.
35% stated that, according to school regulations, all items of school uniform could be purchased from any shop. However, 19% said that this was not possible with almost half of them reporting that at least one item had to be branded. Of those reporting that school regulations require items of school uniform to be purchased from specialist suppliers, 28% stated that they need to buy one or two items, however, 41% reported the requirement to buy 3 or 4 items, 18% were required to purchase 5 or 6 items and 13% to buy more than 6 items. Of those respondents who identified that at least one item needed to be purchased from a specialist supplier, 76% stated that there was only one designated supplier, 21% said there were two, and 2% reported three suppliers were available.
A school policy for selling or swapping pre-loved school uniform was reported to be in place by 32% of individuals and 51% said that they did not know. Only 30% of people replying reported that they knew of any other sources of getting pre-loved school uniforms. The main sources identified were Facebook Parents Page by 60% of those responding. Much smaller numbers, 10% or less in each case, identified friends and siblings, Facebook Marketplace, charity shops, council clothing banks, local churches and second-hand clothing shops.
School Meals
Of the respondents, 67% stated that they paid for their children’s school meals, which included packed lunches. Of the 335 who answered that they did not pay for school meals, 42% stated that they received Infant Free School Meals, 44% reported receiving means-tested Free School Meals, and 15% said their children qualified, for but did not receive free school meals.
Of those who stated that they pay for their children’s school meals, the weekly spend for one child per week is shown in the table below. The average spend was £16 to £20 per week.
| Weekly Cost School Meals | Primary | Secondary | Total | |||
| No | % | No | % | No | % | |
| £1 – £5 | 2 | 1.4% | 11 | 5.0% | 13 | 3.6% |
| £6 – £10 | 20 | 14.3% | 16 | 7.2% | 36 | 10.0% |
| £11 – £15 | 73 | 52.1% | 51 | 23.1% | 124 | 34.3% |
| £16 – £20 | 22 | 15.7% | 71 | 32.1% | 93 | 25.8% |
| £21 – £25 | 8 | 5.7% | 47 | 21.3% | 55 | 15.2% |
| £26 – £30 | 6 | 4.3% | 14 | 6.3% | 20 | 5.5% |
| £31 – £35 | 1 | 0.7% | 4 | 1.8% | 5 | 1.4% |
| £36 – £40 | 4 | 2.9% | 0 | 0.0% | 4 | 1.1% |
| £41 – £45 | 1 | 0.7% | 1 | 0.5% | 2 | 0.6% |
| £46 – £50 | 2 | 1.4% | 3 | 1.4% | 5 | 1.4% |
| Over £50 | 1 | 0.7% | 3 | 1.4% | 4 | 1.1% |
*Weekly cost of school meal per child.
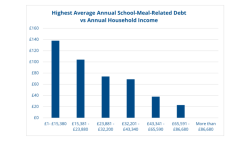
Of those who said that they pay for school meals 19% reported that they had faced money debt due to school-meal-related costs. School-meal-related debt ranged from £6 to £840 as shown in the table below.
35 people, 52% of those saying they had incurred meal-related debt, faced debt up to £60. The average amount of meal-related debt reported was in the range of £61 to £80. Debt of over £100 was reported by 21 people which is 31% of the total.
| Amount of School Meal Related Debt | No | % |
| £6 – £20 | 9 | 13.4% |
| £21 – £40 | 14 | 20.9% |
| £41 – £60 | 12 | 17.9% |
| £61 – £80 | 5 | 7.5% |
| £81 – £100 | 6 | 9.0% |
| £101 – £150 | 10 | 14.9% |
| £151 – £250 | 8 | 11.9% |
| £250 – £500 | 2 | 3.0% |
| £840 | 1 | 1.5% |
*Highest amount of debt ever faced due to school-meal-related costs.
The percentage of individuals reporting having faced school-meal-related debt decreases in line with increases in annual household income – this relationship and the respective numbers are shown in the table below. While only one respondent with no income reported to have faced school-meal-related debt 72% of the respondents replying they have faced school-meal-related debt were in households with incomes less than £32,200. However, 19% were in the income ranges above £43,300. Only households with an income over £131,180 reported no debt. It should also be noted that only one person with no income reported to have faced school-meal-related debt which reflects the effect of free school meals.
| Annual Household Income Range | Number Reporting School-Meal-Related Debt | % |
| No income | 1 | 1.3% |
| £1 – £15,380 | 23 | 30.3% |
| £15,381 – £23,880 | 19 | 25.0% |
| £23,881 – £32,200 | 12 | 15.8% |
| £32,201 – £43,340 | 7 | 9.2% |
| £43,341 – £65,590 | 9 | 11.8% |
| £65,591 – £86,680 | 3 | 3.9% |
| £86,681 – £131,180 | 2 | 2.6% |
| More than £131,180 | 0 | 0.0% |
*Number of people reporting to have faced school meal related money debt relative to household income.
In a similar vain, the average highest school-meal-related debt was £138 for the £1-£15,380 income range, decreasing to £104 for the £15,381 – £23,880 income bracket, £74 for income range of £23,881 – £32,200, £69 for those in the range £32,201 – £43,340, £38 for those in the income range £43,341 – £65,590, and £23 for individuals in the £65,591 – £86,680 range.
Individuals, who said they were single parents or carers, reported a mean highest school-meal-related debt of £100. For two parents/carer families this was £95, and for those reporting three parents/carers of children this decreased to £40.
Extra School Activities
The cost of paying for extra school activities was problematic. 83% of people responding said that they had to pay for extra school activities, such as school trips, uniform days and fundraisers. The activities identified as costing the most in the last year were:
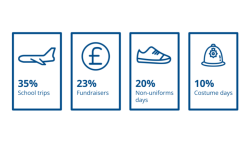
At secondary school level proms and school merchandise were also identified as expensive extra activities (6%).
The amount spent on extra-curricular activities by those people is shown in the table below. Average annual spend on extra school activities was reported to be in the range of £ 101 – £150 with that of £51-150 for primary school children and £101-£150 for secondary school. A spend of over £400 was reported for 5% of secondary school children compared with 4% for primary school.
| Annual Cost of Extra School Activities | Primary | Secondary | Total
|
|||
| No | % | No | % | No | % | |
| £1 – £50 | 117 | 51.3% | 69 | 32.9% | 186 | 40.1% |
| £51 – £100 | 54 | 23.7% | 67 | 31.9% | 121 | 26.2% |
| £101 – £150 | 21 | 9.2% | 33 | 15.7% | 54 | 11.7% |
| £151 – £200 | 12 | 4.3% | 7 | 3.3% | 19 | 4.1% |
| £201 – £251 | 7 | 3.1% | 13 | 6.2% | 20 | 4.3% |
| £251 – £300 | 7 | 3.1% | 11 | 5.2% | 18 | 3.9% |
| £301 – £350 | 2 | 0.9% | 1 | 0.5% | 3 | 0.6% |
| £351 – £400 | 3 | 1.3% | 2 | 1.0% | 5 | 1.1% |
| £401 – £450 | 1 | 0.4% | 4 | 1.9% | 5 | 1.1% |
| £451 – £500 | 1 | 0.4% | 3 | 1.4% | 4 | 0.9% |
| over £500 | 3 | 1.3% | 24 | 11.4% | 27 | 5.8% |
*Annual cost of extra school activities per child.
Overall, 28% of respondents reported that their children had been unable to participate in extra school activities because they were not able to face those costs. For primary school children this position was reported by 19% compared with 38% for secondary school children.
Concluding Findings
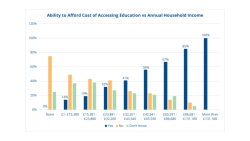
When asked whether respondents of the survey would be able to afford the costs of their children accessing education without cutting back on essentials such as food and bills, 62% said ‘no’ or that they didn’t know – only 38% of the survey respondents replied they could confidently afford those costs. According to our results, there is a correlation between household income and the ability to afford those costs without cutting back on essentials.
Only parents and carers with an annual household income of over £65,591 said they could afford the costs of their children accessing school without cutting back. Out of the households with an income between £43,341 and £65,590, 34% of the respondents still answered they couldn’t or didn’t know whether they are able to afford those costs. For the income band of £23,881 – £32,200 this number almost doubles to 67%, and it further increases to 81% for respondents with a household income £15,381 – £23,880, to 86% for those earning between £1 and £15,380, and finally a shocking 100% for respondents without an income.
Recommendations:
Survey respondents who stated that they had faced difficulties to cover school-related costs, suggestions of adjustments that would ease some of those costs were made.
- Call for reduction of costs of school uniform, including making uniforms available in all shops, non-branded or having a logo (65%)
- School meals should be free for all children (25%)
- The purchase of uniform items and PE kit could be made easier by having a monthly installment scheme (21%)
- School trips should be made cheaper by choosing cheaper options or subsiding the costs (18%).
Citizens Advice County Durham recommends:
- Schools should follow the legal Government guidance on the cost of school uniforms, to ensure that they are affordable and not a barrier to applying for, and attending, a school. The number of branded items in the uniform should be limited, and sew-on badges re-introduced.
- Schools should ensure that they check eligibility for means-tested free school meals for all pupils receiving infant free school meals.
- The cost of extra-curricular activities is kept to a minimum for all students regardless of income.
- Travel costs to attend an education setting are fair and reflective of the current financial climate.
- All schools and academies should look at Poverty Proofing the school day by contacting Children North East children-ne.org.uk/poverty-proofing-the-school-day